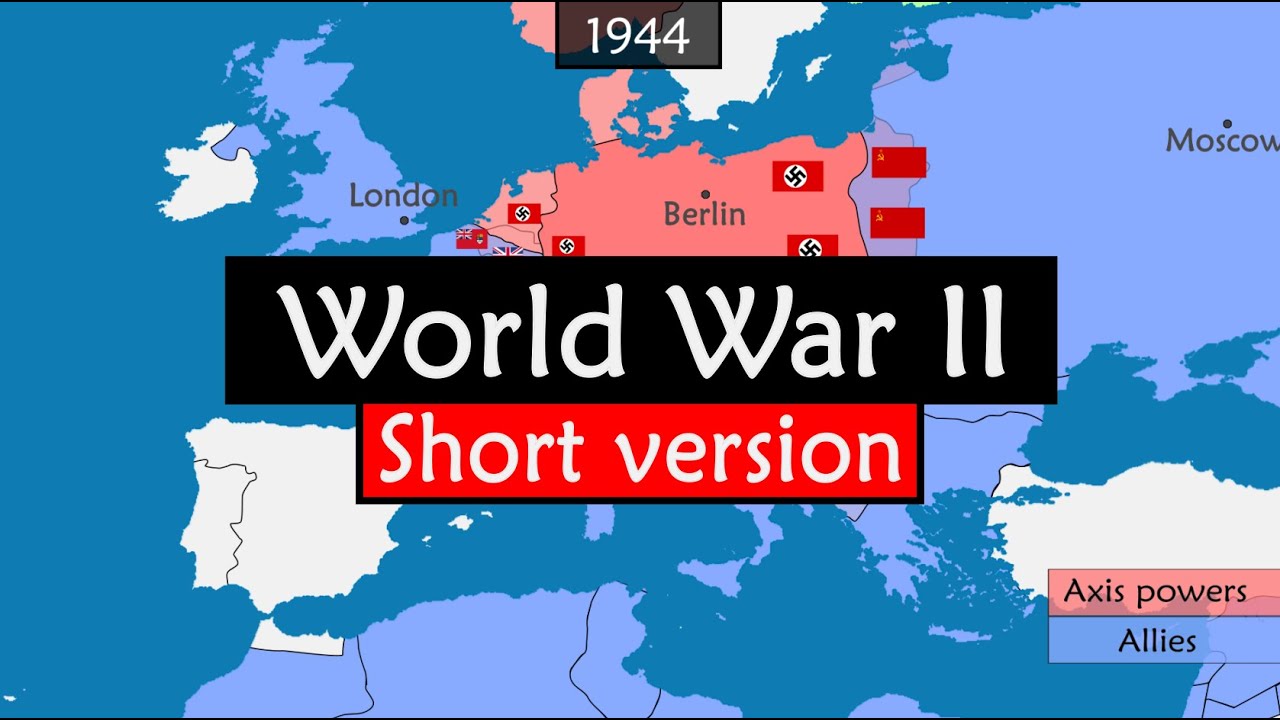
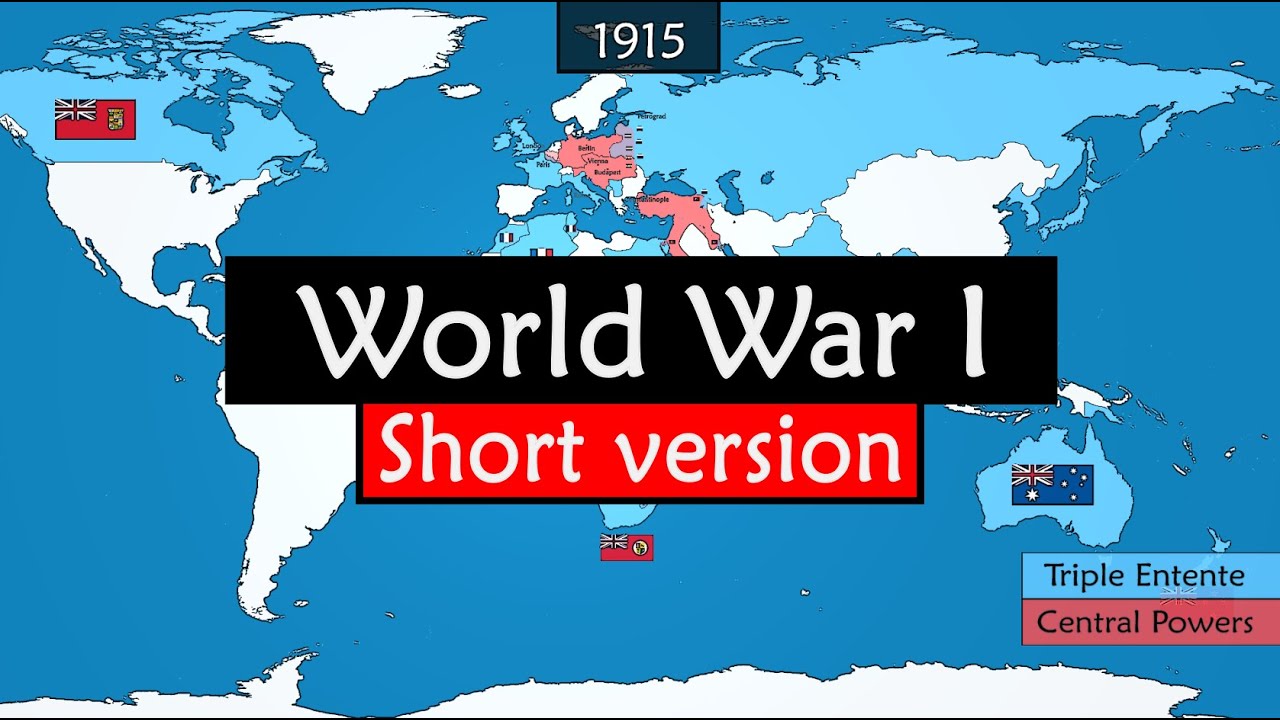
Nuclear History on an Animated Map
A chronological nuclear-history explainer that uses one animated atlas, sparse dates, territory colours and simple mechanism diagrams.
By @GeoHistory for Geo HistoryRuns 16:27

This film opens with Library
A free account opens 100 hand-picked films. Library opens all 4,570 of them for $6 a month.
Free takes an email or Google, no card. See the plans
Why it works
The map keeps a stable visual frame while 56 in-shot changes locate each new date, actor or mechanism; the first change arrives at 0:00.6. Sparse territory fills and diagrams make abstract science legible, and the 4:33–4:47 Japan sequence aligns with the strongest replay peak in the measured six minutes (4:36–4:46). The full video is a long-form explainer, so this is a useful map-animation reference but a poor fit for a short-video library.
Films like this
Tagged after effectsanimated maphistorical timelinescience explainergeopoliticsvector animationdocumentary voiceoverinfographic