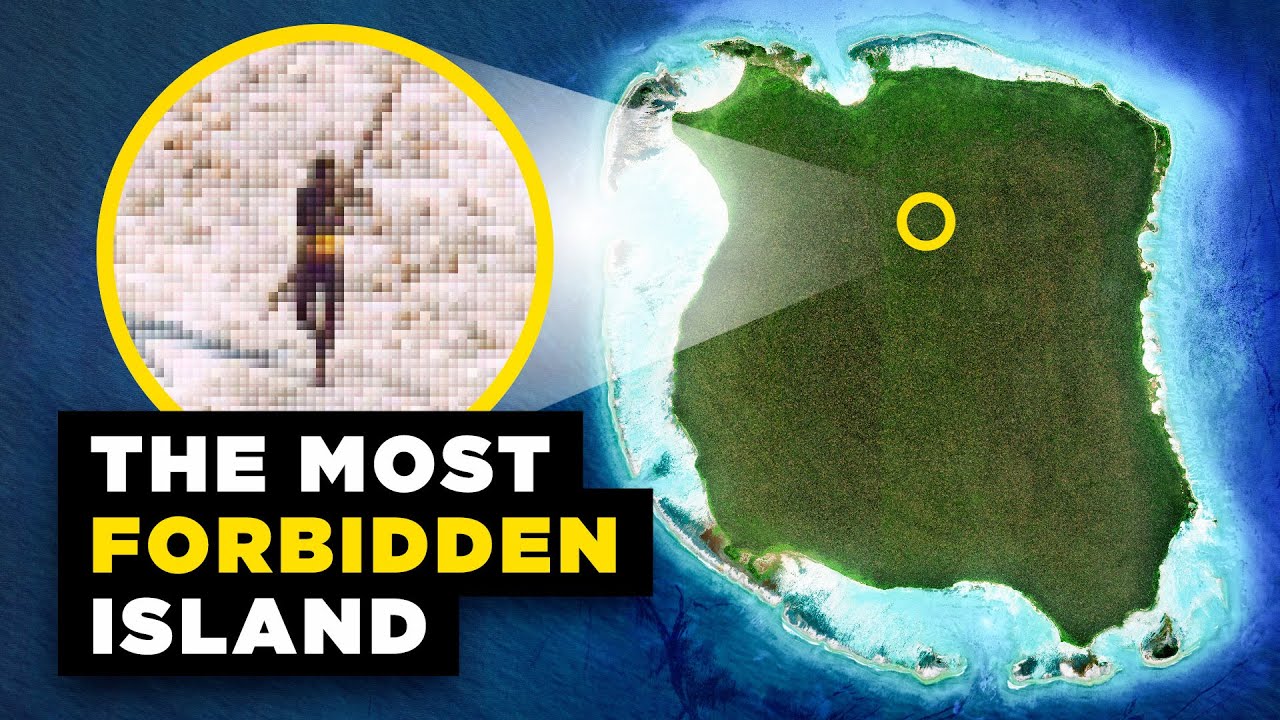
Mexico’s Population Map Puzzle
A narrated geographic explainer uses layered maps, historical comparison and climate overlays to unpack an uneven population pattern.
By @RealLifeLore for RealLifeLoreRuns 29:58
This film opens with Library
A free account opens 100 hand-picked films. Library opens all 4,570 of them for $6 a month.
Free takes an email or Google, no card. See the plans
Why it works
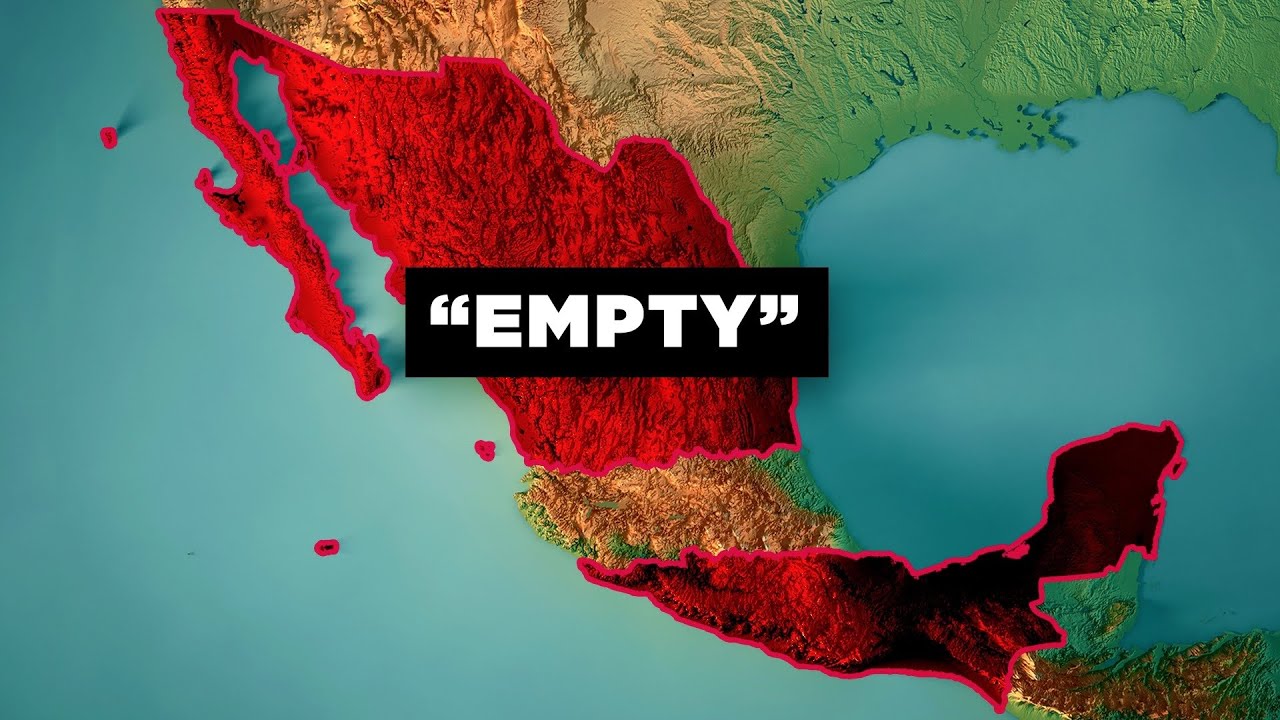
The map establishes location by 0:00.25, then timed outlines, icons and region fills make the 18% versus 82% imbalance visible by about 0:46. A 130-year comparison and US counterexample hold the question open until the 3:35 re-hook; the climate overlay at 3:58 supplies a visual answer. The measured segment has only 13 cuts in six minutes, yet 35 internal graphic steps keep the long map shots informative.
Films like this
Tagged geolayers 3maptileropenstreetmapafter effectslive actiongeography explaineranimated mapssatellite map