Why Two Neighboring States Have Vastly Different Populations
A map-led geographic explainer builds a controlled comparison before revealing a tenfold population gap and escalating to city-scale proof.
By @RealLifeLore for RealLifeLoreRuns 20:35

This film opens with Library
A free account opens 100 hand-picked films. Library opens all 4,570 of them for $6 a month.
Free takes an email or Google, no card. See the plans
Why it works
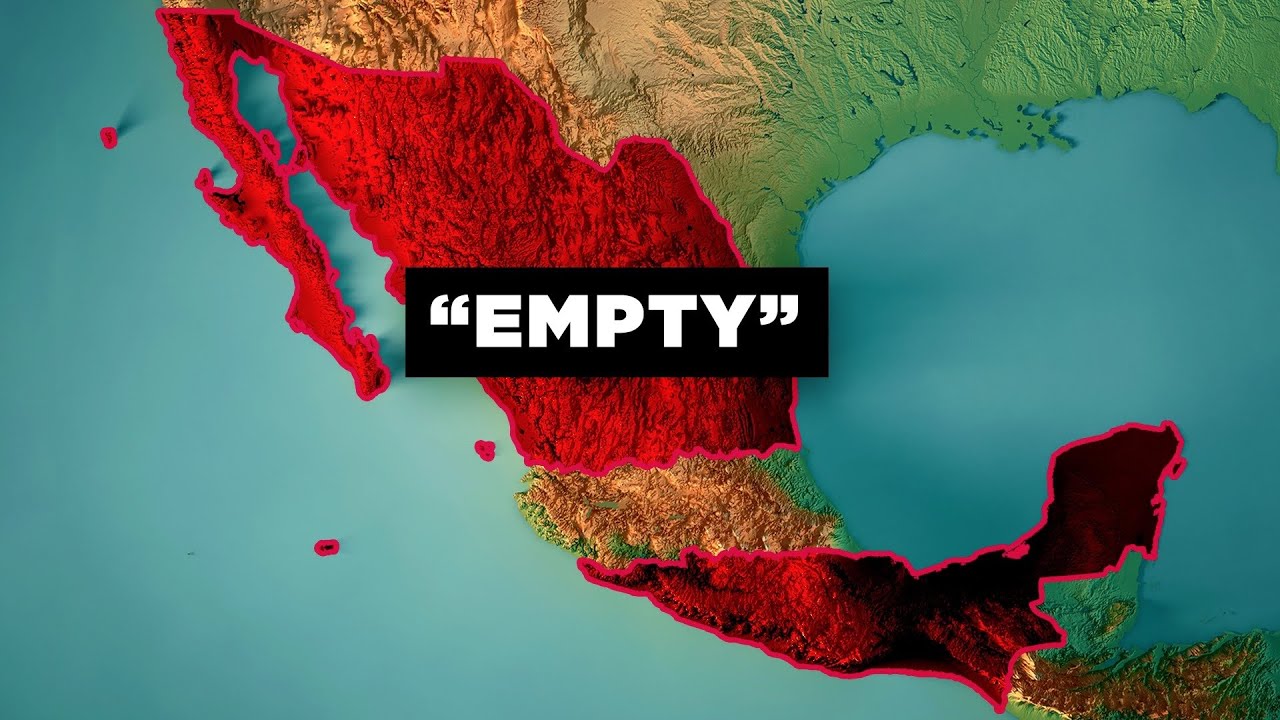
The first 1:40 makes neighboring states look comparable before the roughly 580,000 versus 5.8 million reveal at 1:51–2:05. It refreshes that contrast with density at 2:16, four towns above 30,000 at 3:55–4:05, and a regional population share at 4:55–5:09; the four-town section overlaps a replay peak at 3:54.8–4:07.2. Animated map labels, colored polygons, and brief aerial views turn each scale change into visible evidence.
Films like this
Tagged geolayers 3maptilerlive actiongeography explaineranimated mapssatellite imagerydata visualizationdocumentary voiceover