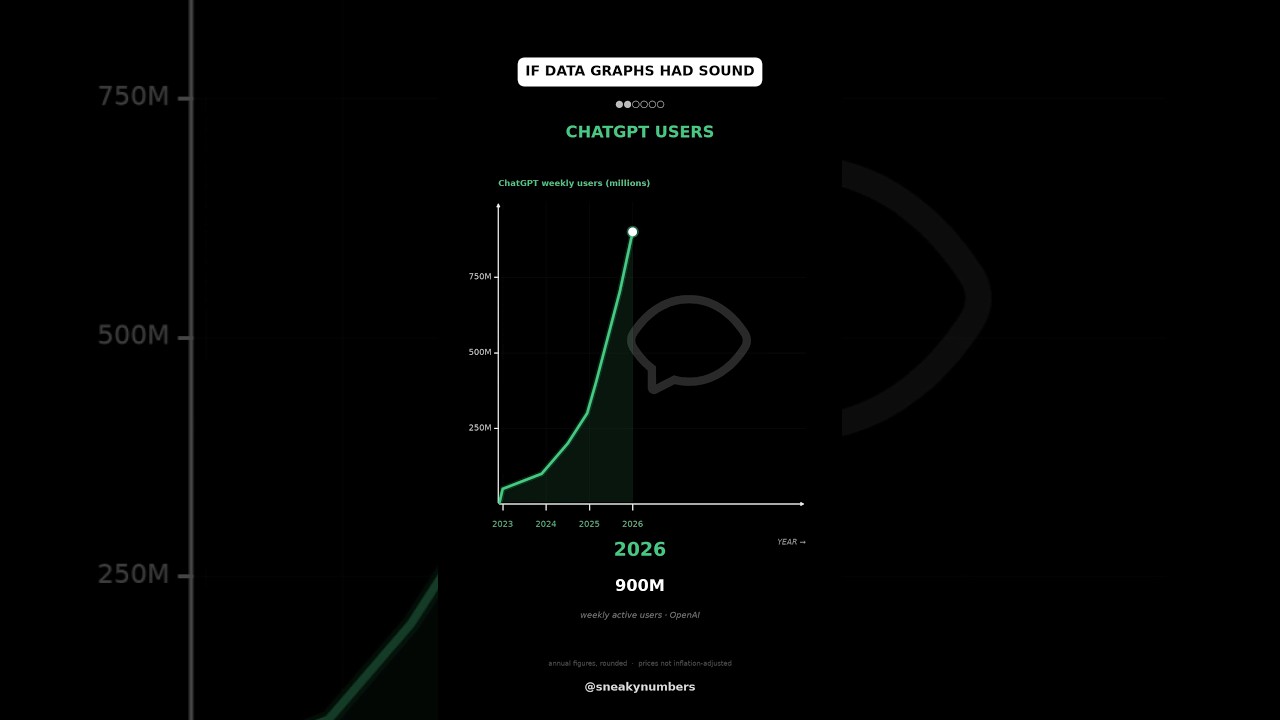
Six life trends drawn as sound-driven graphs
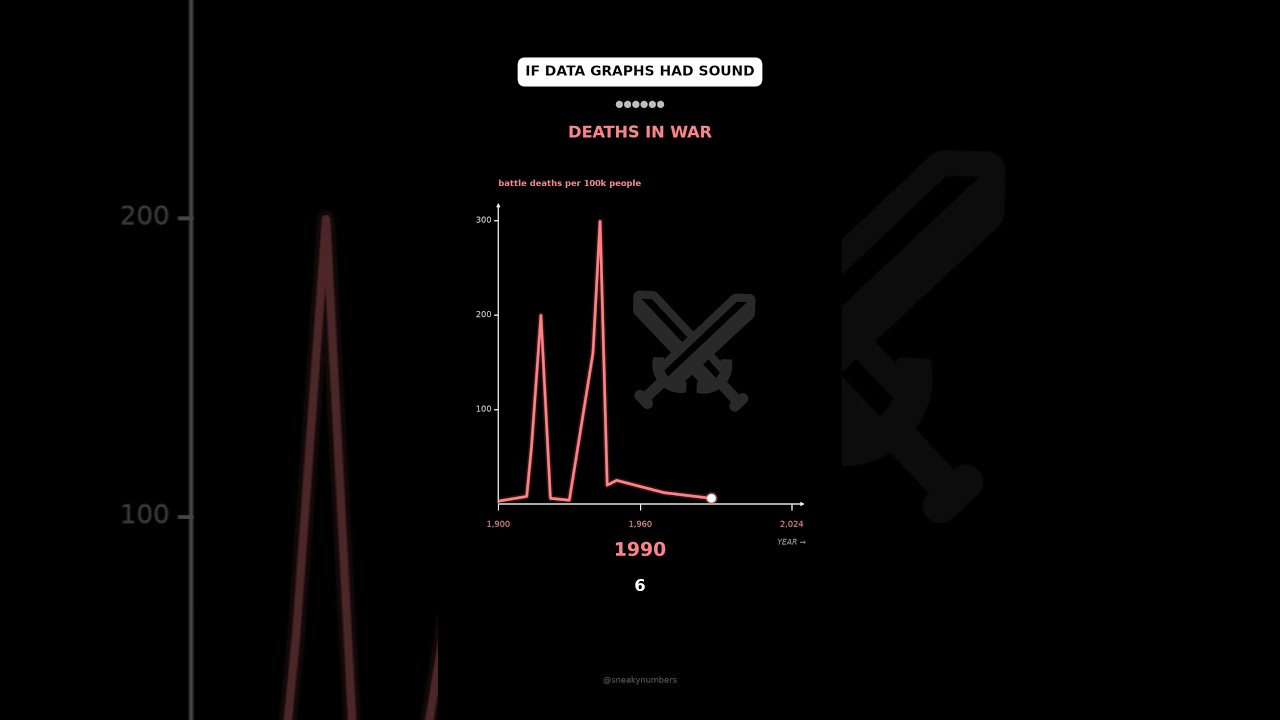
A 24-second vertical motion graphic cycles through six colour-coded life and history trends, ending on two stark war-death spikes.
By @SneakyNumbersRuns 00:24
This film opens with Library
A free account opens 100 hand-picked films. Library opens all 4,520 of them for $6 a month.
Free takes an email or Google, no card. See the plans
Why it works
A visible data point starts at frame 0, so the viewer learns the chart rule immediately. One locked shot holds the axes steady while six data chapters change inside it; the cue cluster at frames 621–639 supports the final extreme curve.
Films like this
Tagged verticalmotion graphicsdata visualizationanimated line chartsonificationdark backgroundnumerical storytellingshort form