Six Financial Charts With Sound
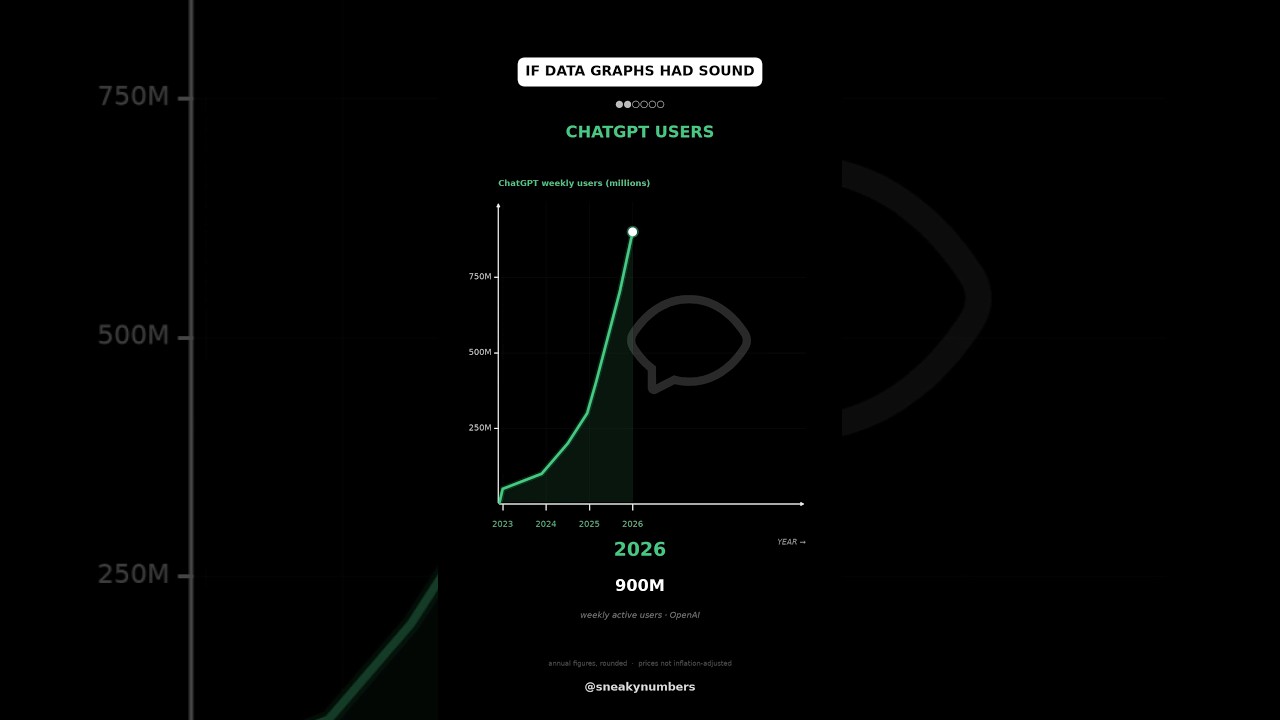
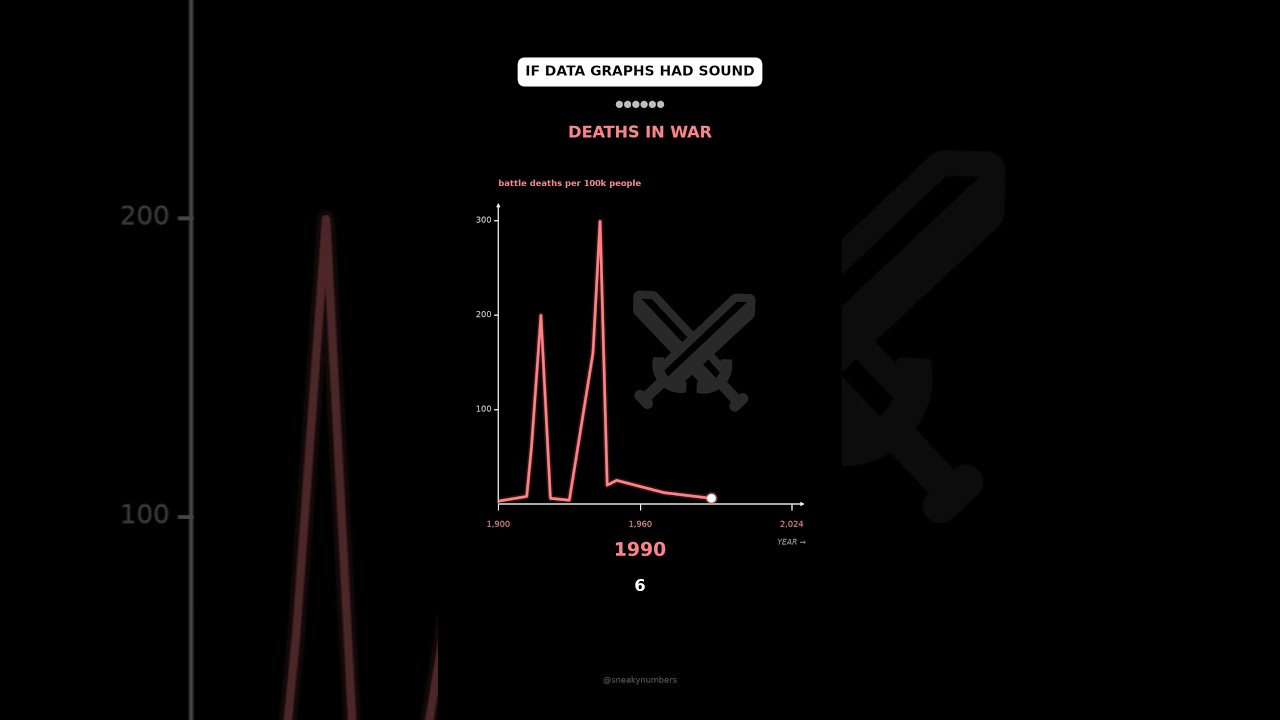
A 24-second vertical motion graphic turns six financial histories into animated, colour-coded charts with live values and sound.
By @SneakyNumbersRuns 00:24

This film opens with Library
A free account opens 100 hand-picked films. Library opens all 4,520 of them for $6 a month.
Free takes an email or Google, no card. See the plans
Why it works
The premise and first plotted point appear at frame 0, then a moving endpoint and live value make each curve readable as an event. One locked shot carries six graph chapters without cuts; the brightness changes at frames 240, 360 and 600 coincide with nearby audio cues at 242, 362 and 602. The same scaffold makes each new contour and unit immediately comparable.
Films like this
Tagged verticalmotion graphicsdata visualizationanimated chartsfinancial datasonificationdark uishort form