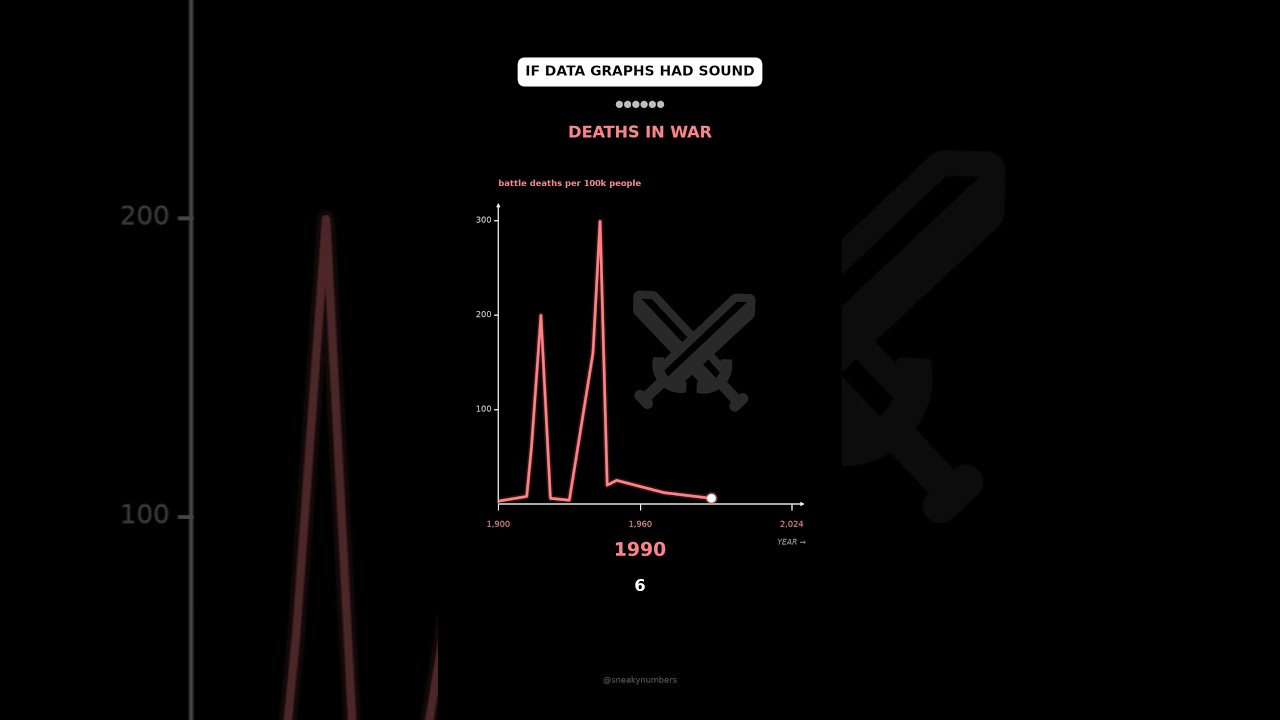
Six Data Trends Played as Sound
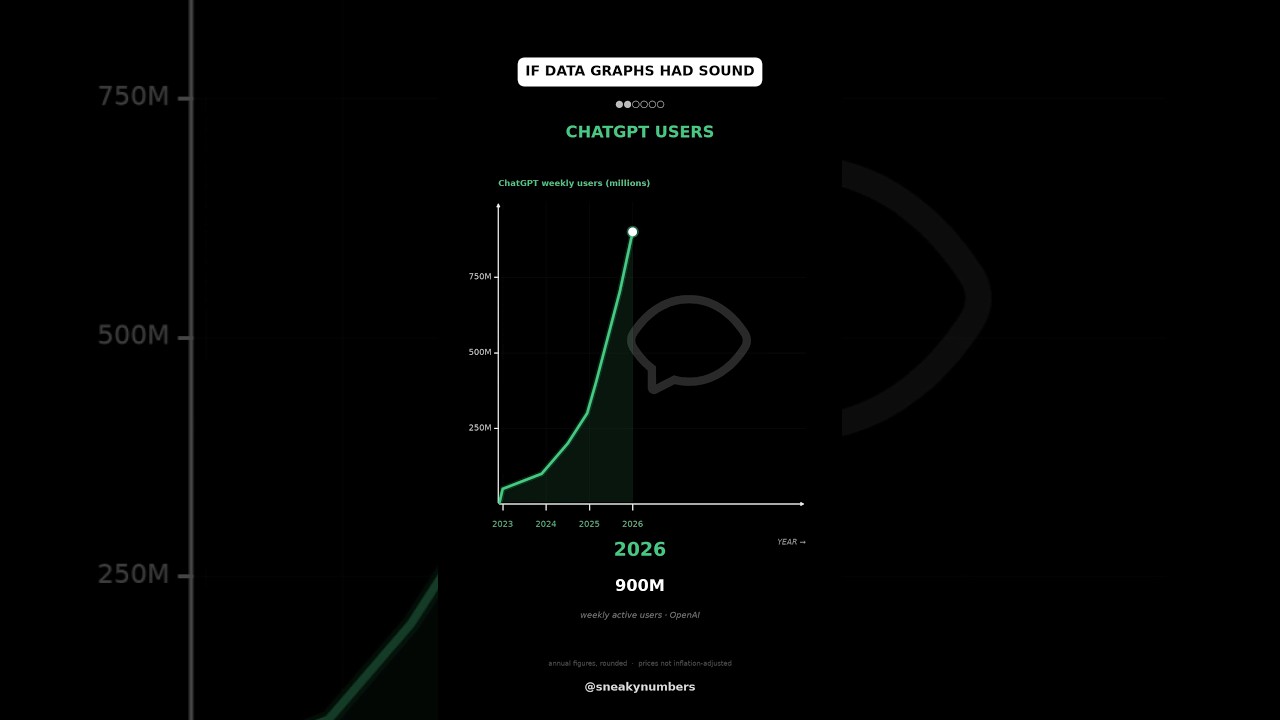
A 24-second vertical motion graphic turns six time-series charts into colored line draws with changing year and value readouts.
By @SneakyNumbersRuns 00:24
This film opens with Library
A free account opens 100 hand-picked films. Library opens all 4,520 of them for $6 a month.
Free takes an email or Google, no card. See the plans
Why it works
The first data point starts the graph immediately, and a moving endpoint couples the line to the year/value readout. Six chart states fit inside one 709-frame shot with no cuts; the f120 and f480 brightness steps mark internal resets, and the final descending cost series changes direction.
Films like this
Tagged verticaldata visualizationanimated chartssonificationdark uimotion graphicsno voiceovershort form