Natural Disaster Graphs That Play Their Data
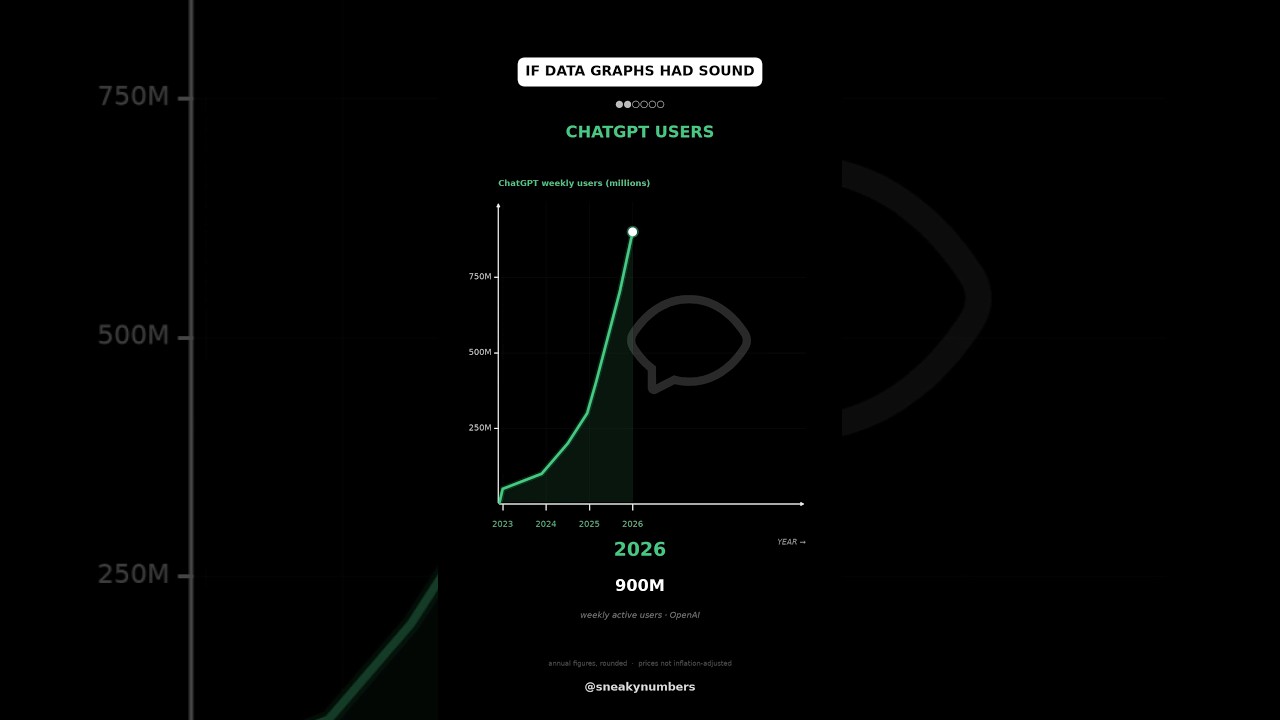
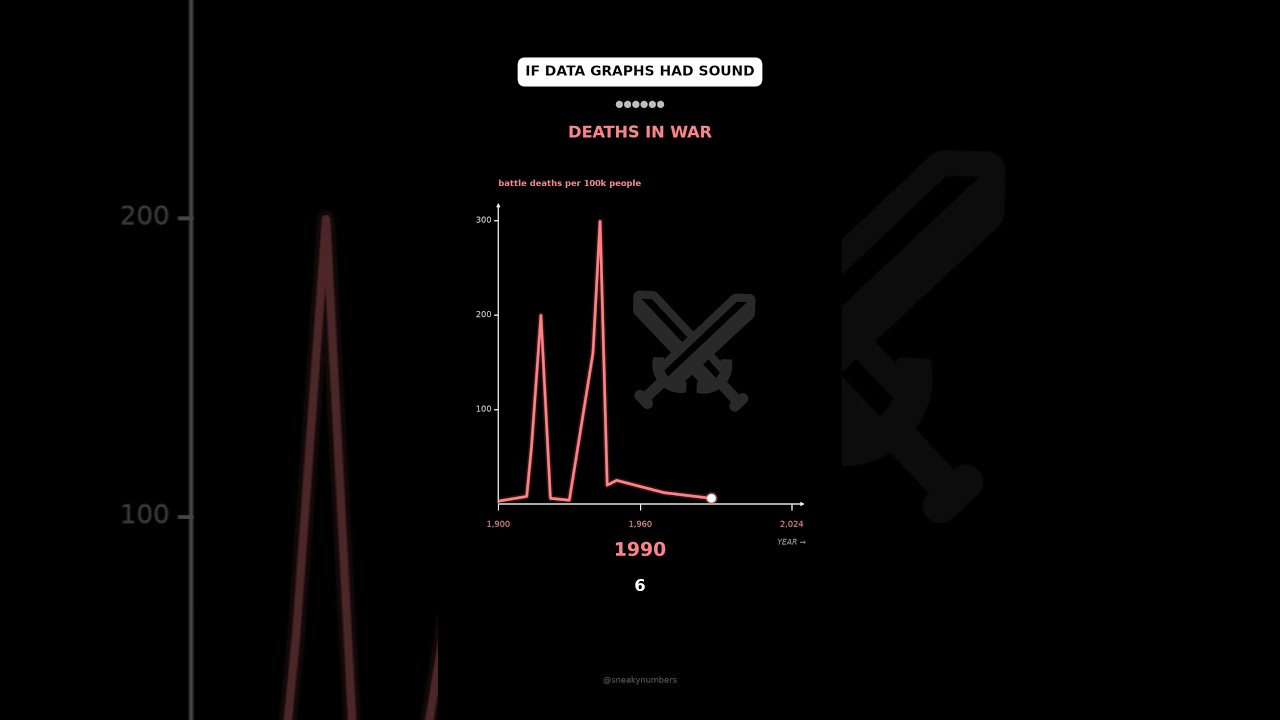
Six sonified disaster charts animate in a fixed vertical layout, changing topic, colour and scale every four seconds.
By @SneakyNumbersRuns 00:24

This film opens with Library
A free account opens 100 hand-picked films. Library opens all 4,520 of them for $6 a month.
Free takes an email or Google, no card. See the plans
Why it works
The conditional premise is on the first frame and the trace begins within 0.25 s, making the sound-to-data rule immediately testable. One locked 720-frame shot lets six charts share a visual grammar, while resets at frames 120, 240, 360 and 600 renew attention without cuts; the sheets also show a reset around frame 480.
Films like this
Tagged data visualizationanimated chartssonificationverticaldark uiline graphinfographicshort form