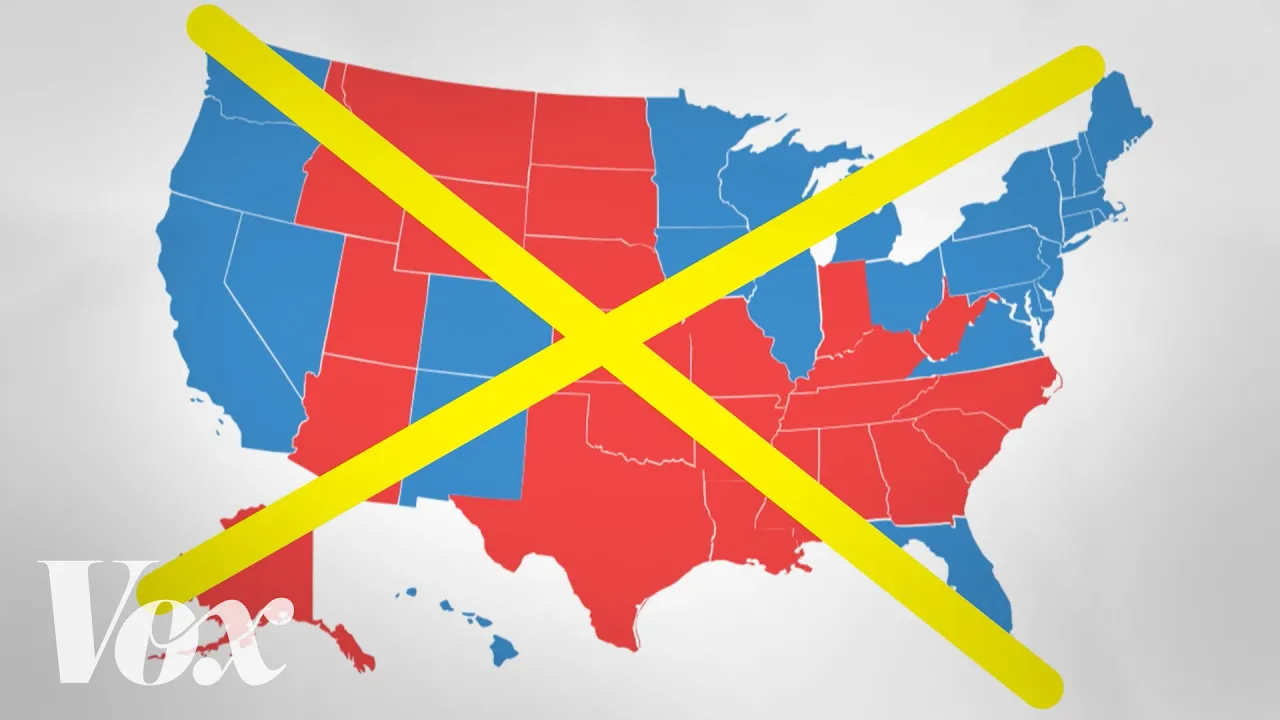
Why the Election Map Misleads
A brisk data explainer turns a familiar red-blue map into a visible design problem, then animates two alternatives.
By @Vox for VoxRuns 02:05
This film opens with Library
A free account opens 100 hand-picked films. Library opens all 4,570 of them for $6 a month.
Free takes an email or Google, no card. See the plans
Why it works
The first 286 frames pile up real-use sightings before shot 13 clears to a pale, inspectable graphic for 361 frames. Shot 17's separated lateral moves point the viewer between two compared units, and shot 22 spends 636 frames visibly rebuilding the encoding. The narration covers 75% of the film, so the graphics answer spoken claims rather than competing with them.
Films like this
Tagged live actiondata visualizationelection mapeditorial explainermotion graphicsarchival montagecartogramkinetic type