Three Mutual Fund Myths, Shown with Data
A presenter-led vertical explainer uses myth cards, comparison tables and market charts to challenge three investing shortcuts.
By @Zero1byZerodha for Zero1 by ZerodhaRuns 01:27

This film opens with Library
A free account opens 100 hand-picked films. Library opens all 4,570 of them for $6 a month.
Free takes an email or Google, no card. See the plans
Why it works
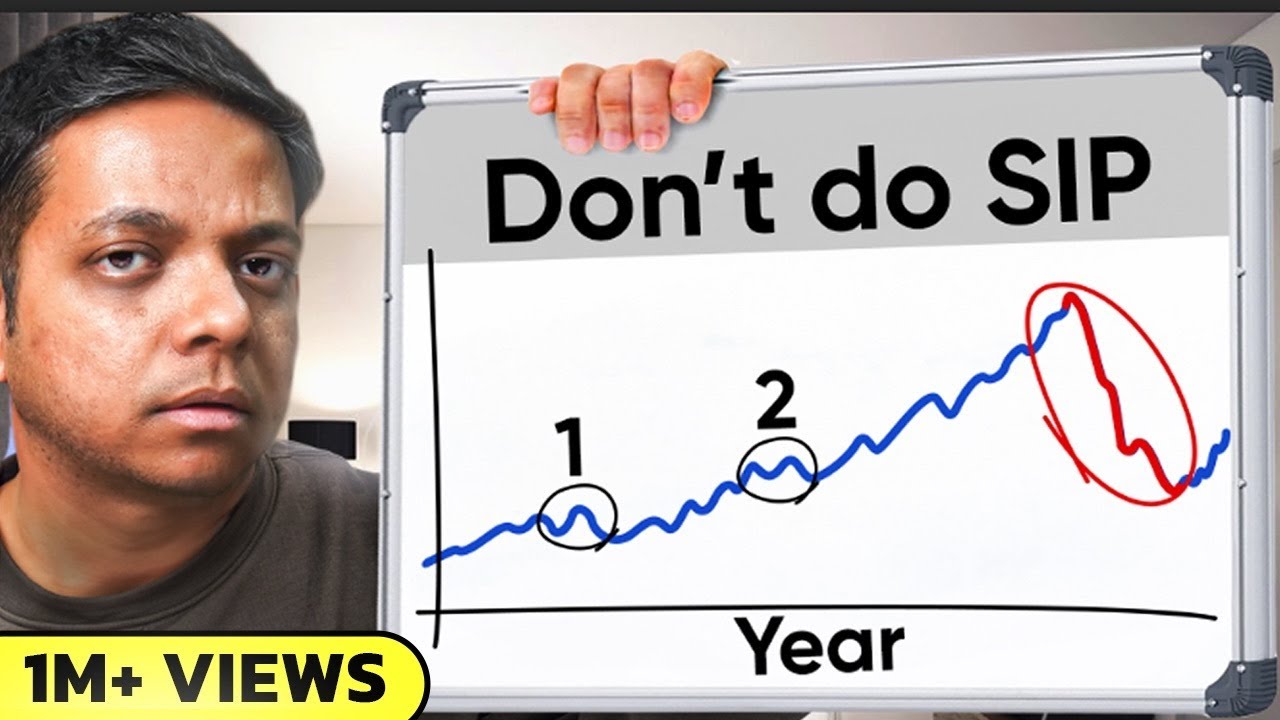
By 0:04 the presenter pairs a contrarian cover line with a promise of three myths, while six logo tiles make the topic concrete. Each misconception gets a different proof panel: category returns at 0:08–0:19, changing rankings around 0:27–0:32, and a market path around 0:39–0:54. The most-replayed interval, 0:17.6–0:18.5, falls during the first table, supporting the value of visible evidence.
Films like this
Tagged live actionverticaltalking headmyth bustingfinancial educationdata visualizationsplit layoutchapter cards