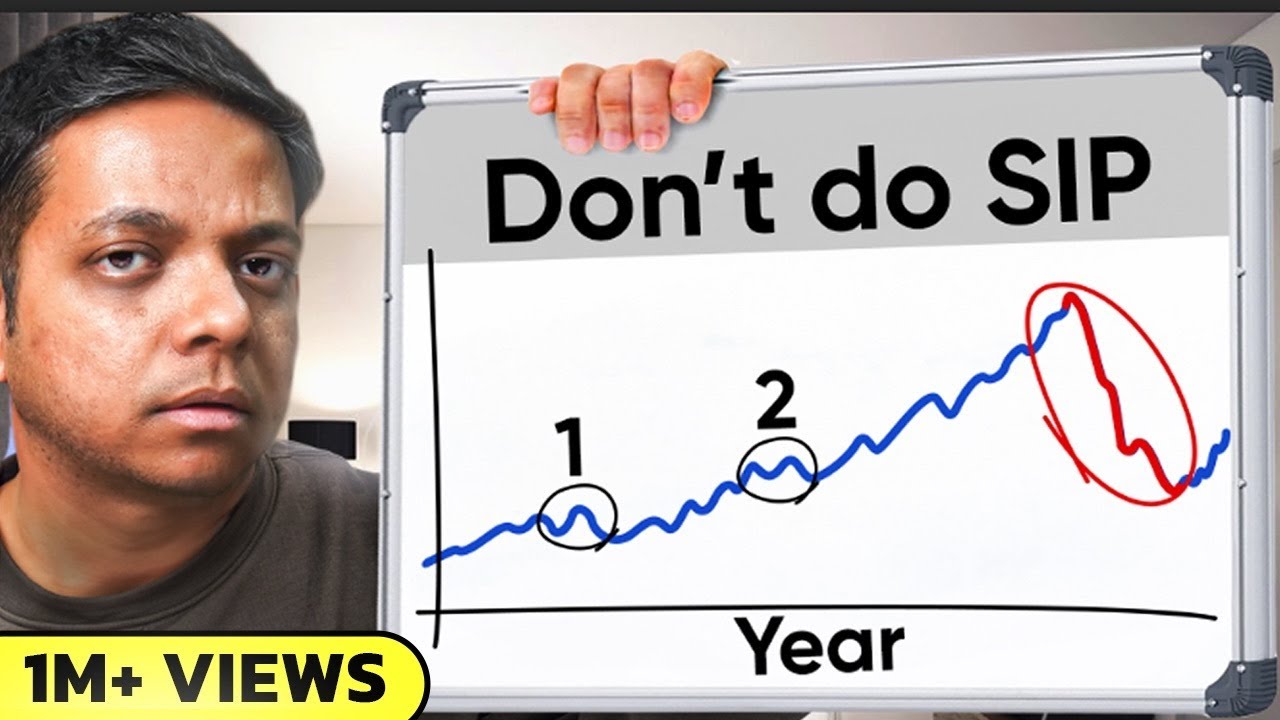
A market crash claim tested across time scales
A presenter tests a worrying market comparison by zooming a live chart out and checking a second data table.
By @Zero1byZerodha for Zero1 by ZerodhaRuns 02:47

This film opens with Library
A free account opens 100 hand-picked films. Library opens all 4,520 of them for $6 a month.
Free takes an email or Google, no card. See the plans
Why it works
The opening pairs a red crisis headline with a specific spoken comparison, then delivers proof at 0:09.6. One chart changes from weekly to monthly to yearly views by 0:32, while a pointing hand keeps the numbers easy to follow. A second source at 1:52.9 complicates the simple winner claim before the practical rule at 2:19.8.
Films like this
Tagged live actionverticalfinance explainertalking headchart walkthroughhandheld proofdata tablesource-led