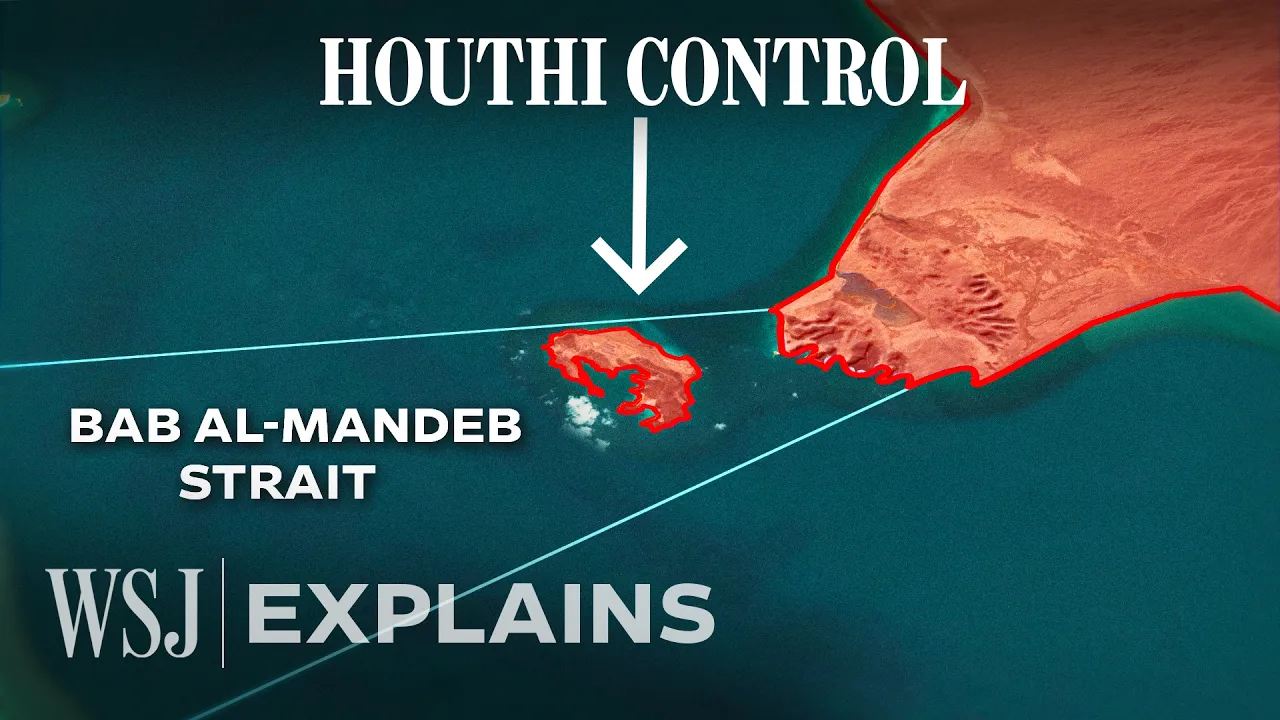
How a Red Sea Chokepoint Shakes Oil Markets
A map-led newsroom explainer turns a territorial change into a physical route, an oil-market mechanism, and a geopolitical dilemma.
By @wsj for The Wall Street JournalRuns 04:04
This film opens with Library
A free account opens 100 hand-picked films. Library opens all 4,570 of them for $6 a month.
Free takes an email or Google, no card. See the plans
Why it works
The first 29 seconds move from an immediate change to a map and clear economic stakes, while the presenter-to-map cut at 2.42 seconds gives the claim a location. Evidence arrives in layers: port footage at 1:10–1:14, a specific daily-volume figure around 1:04, infrastructure footage after 2:00, and charts at 2:25 and 3:42. The 1:10.8–1:13.2 port sequence is also the top replay window, consistent with viewers returning to concrete proof.
Films like this
Tagged live actionnews explainermap animationpresenter leddocumentary footagedata visualizationgeopoliticseditorial graphics