What Sleep Loss Does to the Brain
A narrated science lesson turns sleep-deprivation numbers and biology into evolving hand-drawn diagrams.
By @TEDEd for TED-EdRuns 04:35
This film opens with Library
A free account opens 100 hand-picked films. Library opens all 4,520 of them for $6 a month.
Free takes an email or Google, no card. See the plans
Why it works
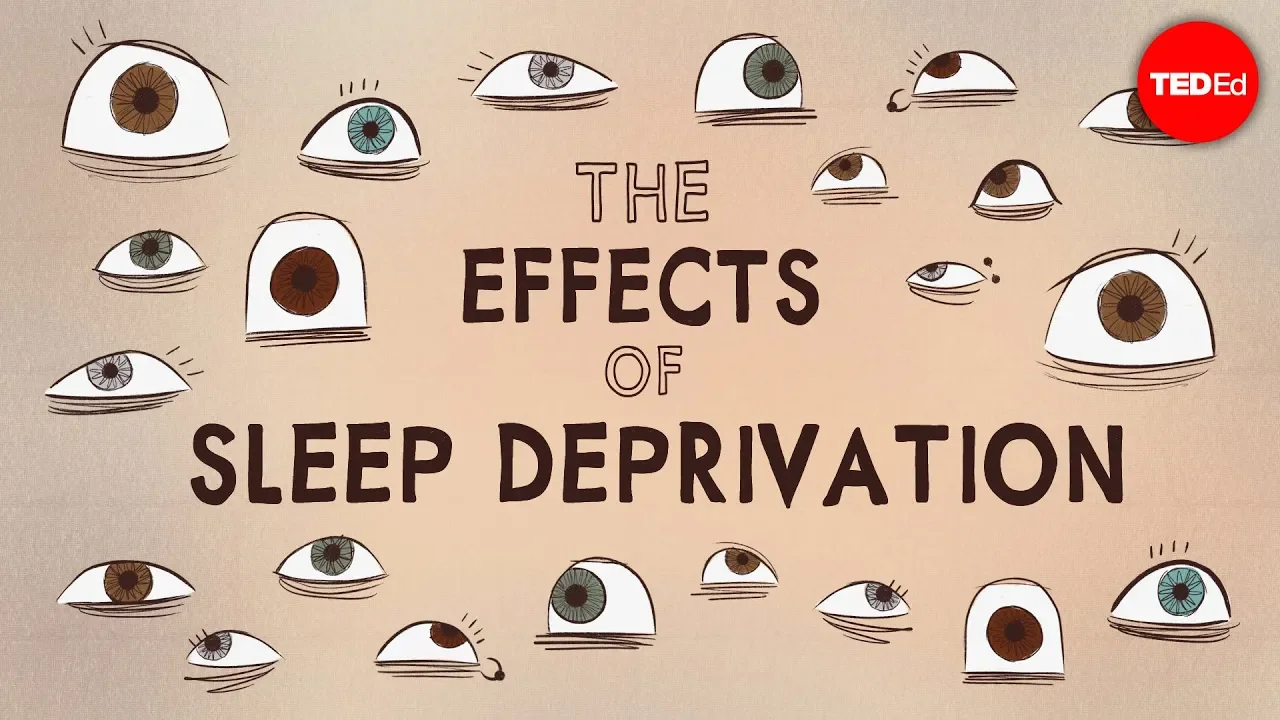
A narrated extreme example becomes an eye-clock in shot 1, making the quantified opening easy to picture. The long measured worlds in shots 2–4 support a causal explanation through small object changes, with hard boundaries at frames 1258, 2190 and 3457 instead of constant cutting. The pale end card starts at frame 6345 after the dark mechanism sequence, giving the destination a clear visual reset.
Films like this
Tagged animated explainerscience educationhand drawnmotion graphicsvisual metaphornarrateddiagram animationlong form