A Hand-Drawn Guide to a Record El Niño
A brisk science explainer that moves from marker-drawn mechanisms to sourced data and real-world consequences, then closes with nuance.
By @AsapSCIENCE for AsapSCIENCERuns 04:58
This film opens with Library
A free account opens 100 hand-picked films. Library opens all 4,570 of them for $6 a month.
Free takes an email or Google, no card. See the plans
Why it works
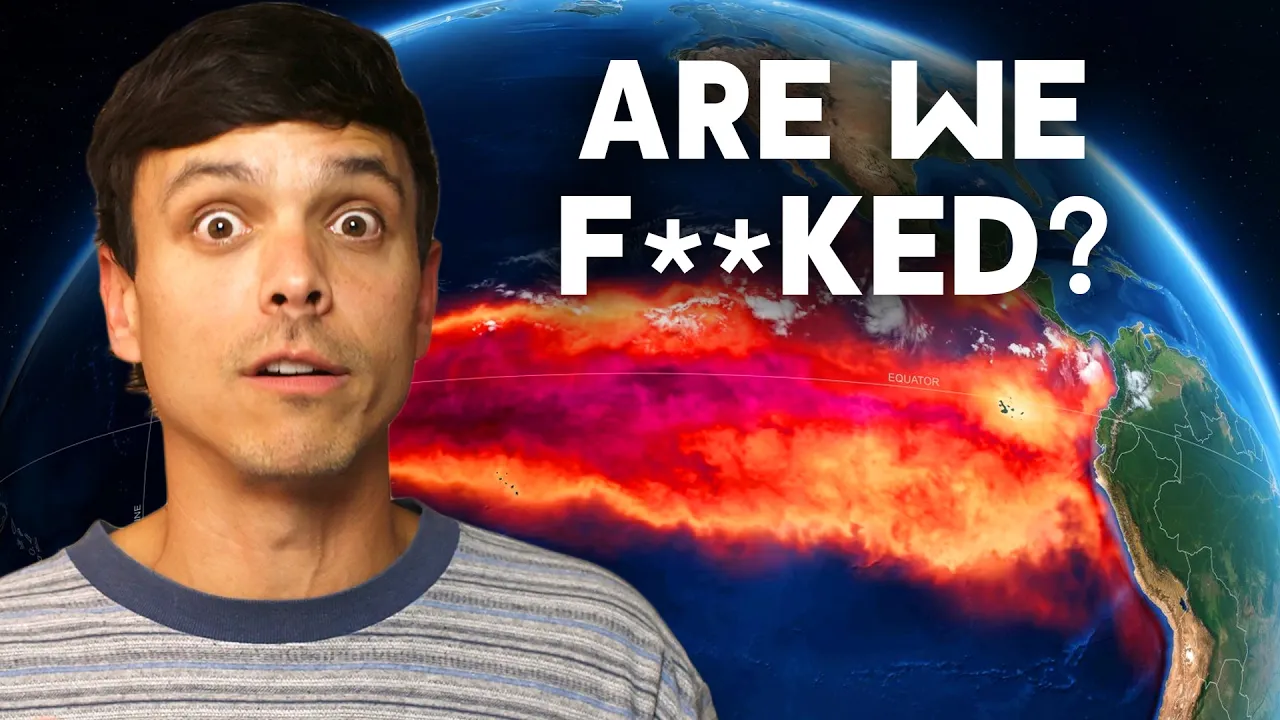
The first 14 seconds turn an extreme claim into a concrete question while a hand builds a globe, and the plain-language promise arrives by 0:21. A simple marker mechanism at 1:33–2:08 makes the data legible before a map-to-storm sequence at 2:11–2:14, the strongest replay peak. Source screens, large figures at 3:12–3:36, and a calmer qualification after 3:41 balance urgency with evidence.
Films like this
Tagged live actionscience explainerhand drawnwhiteboardtalking headdata visualizationdocumentary footageeducational