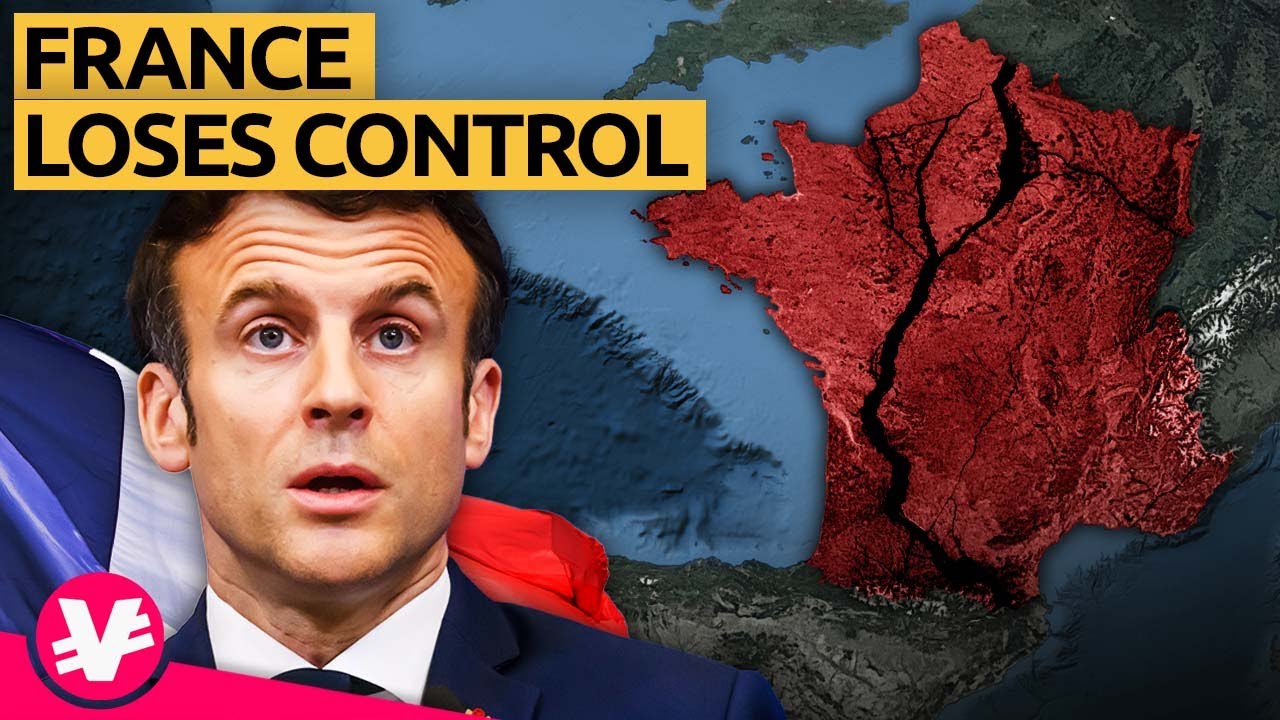
The India–US Tariff Rift Explained
A host-led geopolitical explainer that turns a diplomatic reversal into numbered claims, archival proof, and an oil-dependence chart.
By @visualeconomiken for VisualEconomik ENRuns 15:42

This film opens with Library
A free account opens 100 hand-picked films. Library opens all 4,570 of them for $6 a month.
Free takes an email or Google, no card. See the plans
Why it works
A reversal question arrives immediately, and the first visual flourish appears around 0:02 without interrupting the presenter. Nearly two minutes of prior-alliance context make the tariff figures at 2:07–2:40 feel consequential; the chart-to-refinery sequence at 4:42–5:02 coincides with the strongest replay peak in the measured excerpt. The supplied analysis covers only the first 6:00 of a longer episode.
Films like this
Tagged live actionlong formtalking headnews explainergeopoliticsarchival footagedata chartnumbered points