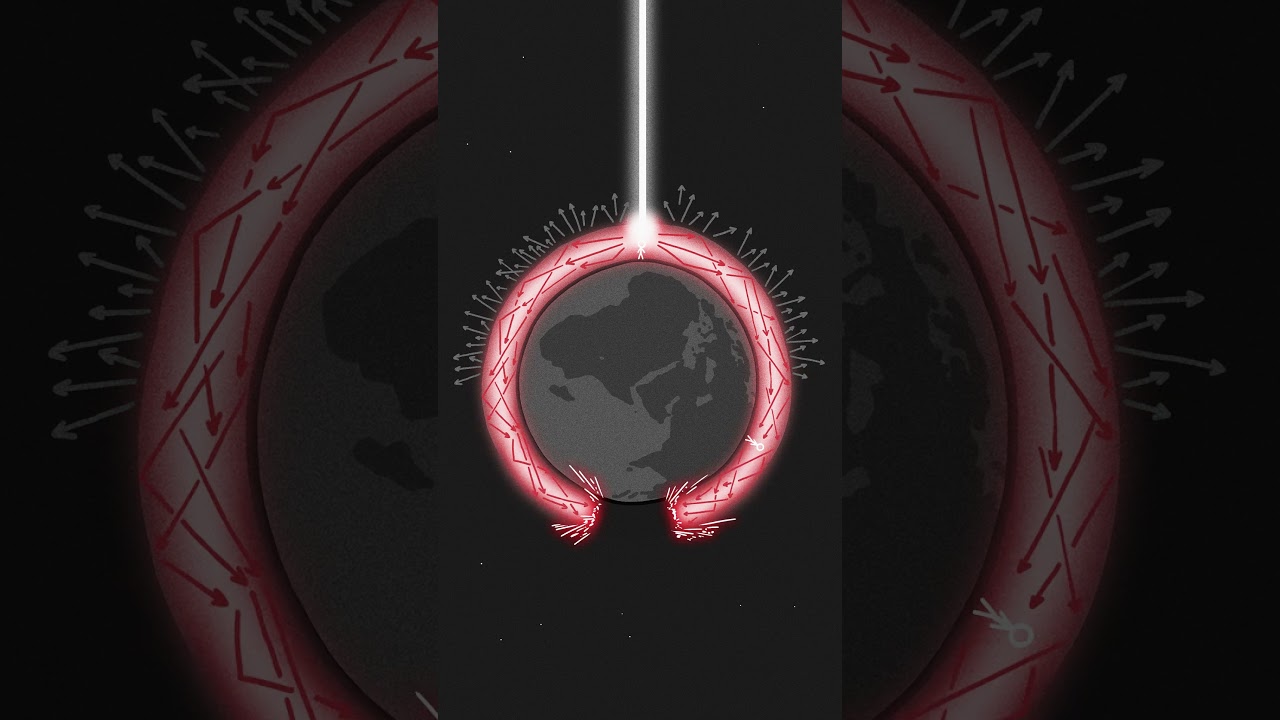
Draining the Oceans, One Map at a Time
A hand-drawn science explainer turns an absurd portal question into a sequence of escalating sea-level maps.
By @xkcd_whatif for xkcd What If?Runs 01:49
This film opens with Library
A free account opens 100 hand-picked films. Library opens all 4,570 of them for $6 a month.
Free takes an email or Google, no card. See the plans
Why it works
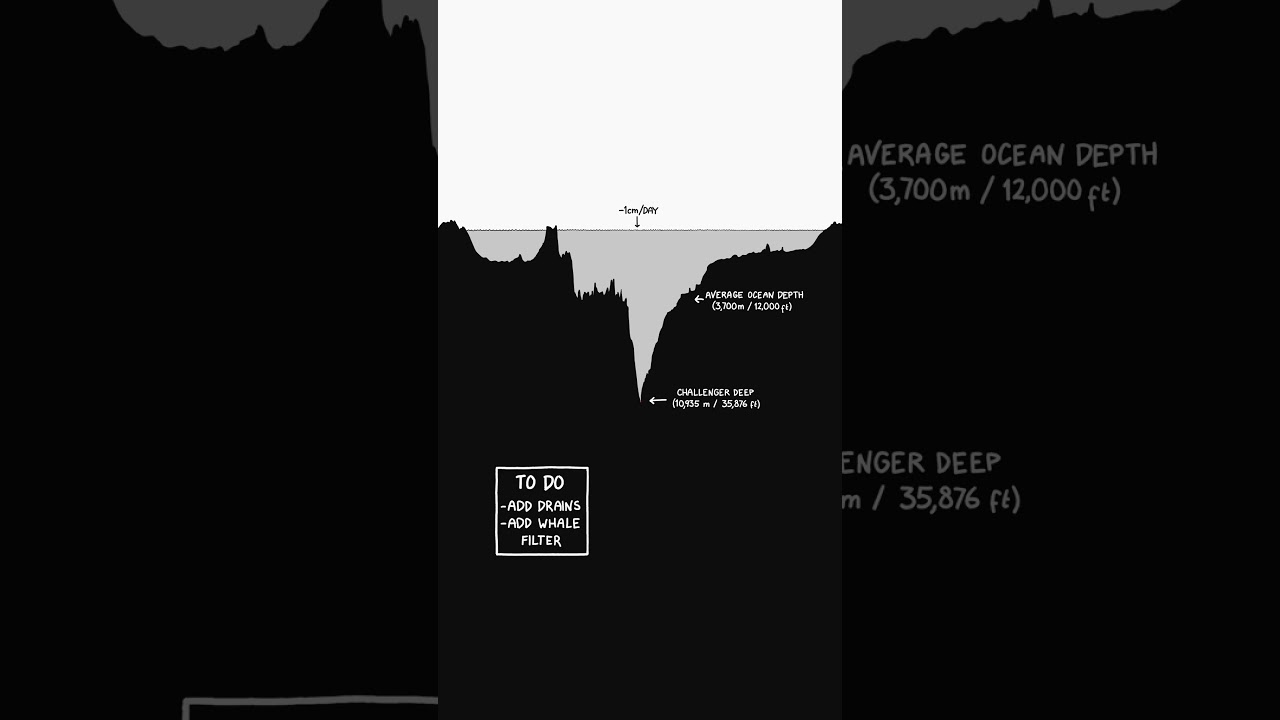
The 0:00 question pairs a precise impossible setup with a readable cutaway, then 0:27–0:41 corrects the expected giant whirlpool with a small measured rate. Fixed-view maps from 0:41 onward reveal new geographic consequences at each depth; the first −50 m change at 0:42.9–0:44.0 is the strongest replay peak. A recurring geographic joke carries the middle, while 1:35 shifts to the ecological cost.
Films like this
Tagged verticalscience explainerhand drawnmap animationnarratedhypotheticalinfographicdeadpan humor