The Currency Trade That Shook Britain
A six-minute measured opening to a financial-history documentary, using archival imagery and spare diagrams to turn a currency crisis into a causal story.
By @BusinessCasual for Business CasualRuns 10:36
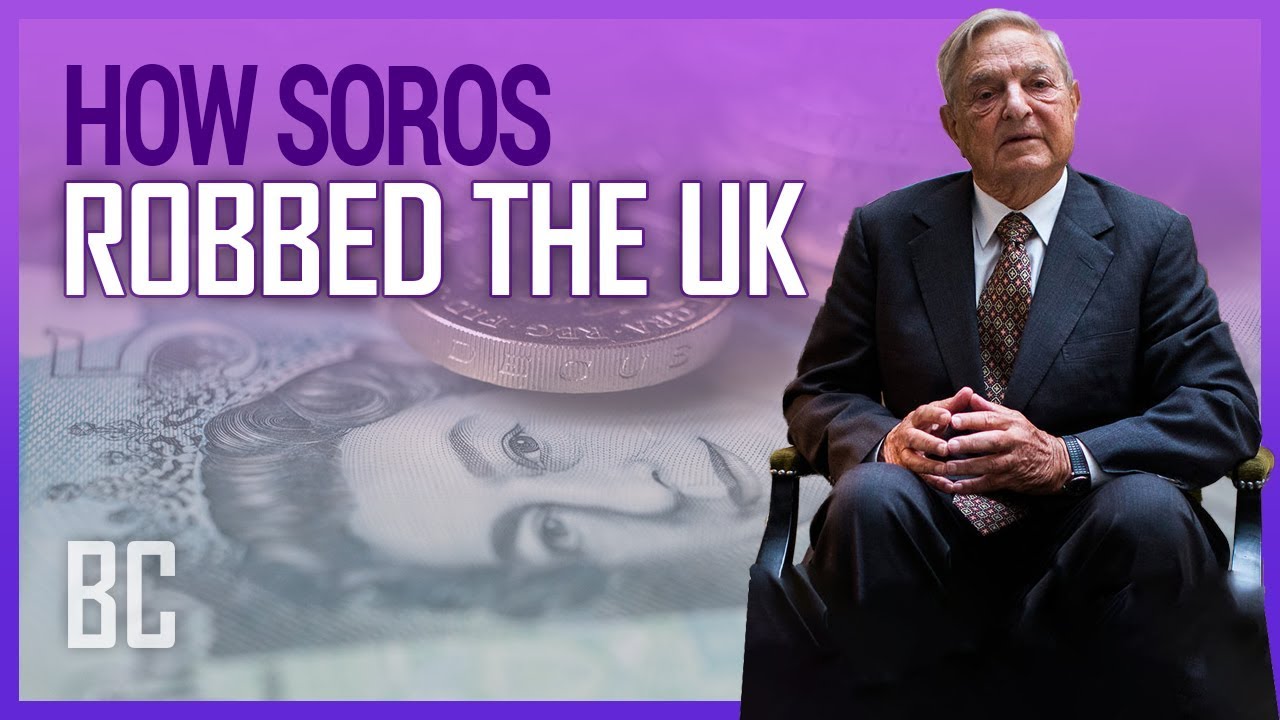
This film opens with Library
A free account opens 100 hand-picked films. Library opens all 4,570 of them for $6 a month.
Free takes an email or Google, no card. See the plans
Why it works
The opening states a billion-dollar outcome by 0:30, then turns the history and fixed-rate rule into a clear causal chain before asking the timing question at 4:58. Brief uppercase labels, a GDP chart at 4:32, and a two-currency diagram at 5:44 make abstract finance visible; that diagram sits inside the measured segment's strongest replay peak at 5:44–5:50. The detector groups many visible edits into 12 broad segments but records 163 internal picture changes in six minutes.
Films like this
Tagged live actionarchival documentaryfinancial explainerhistorical explainervoiceoverlong formpurple graphicsdata visualization


