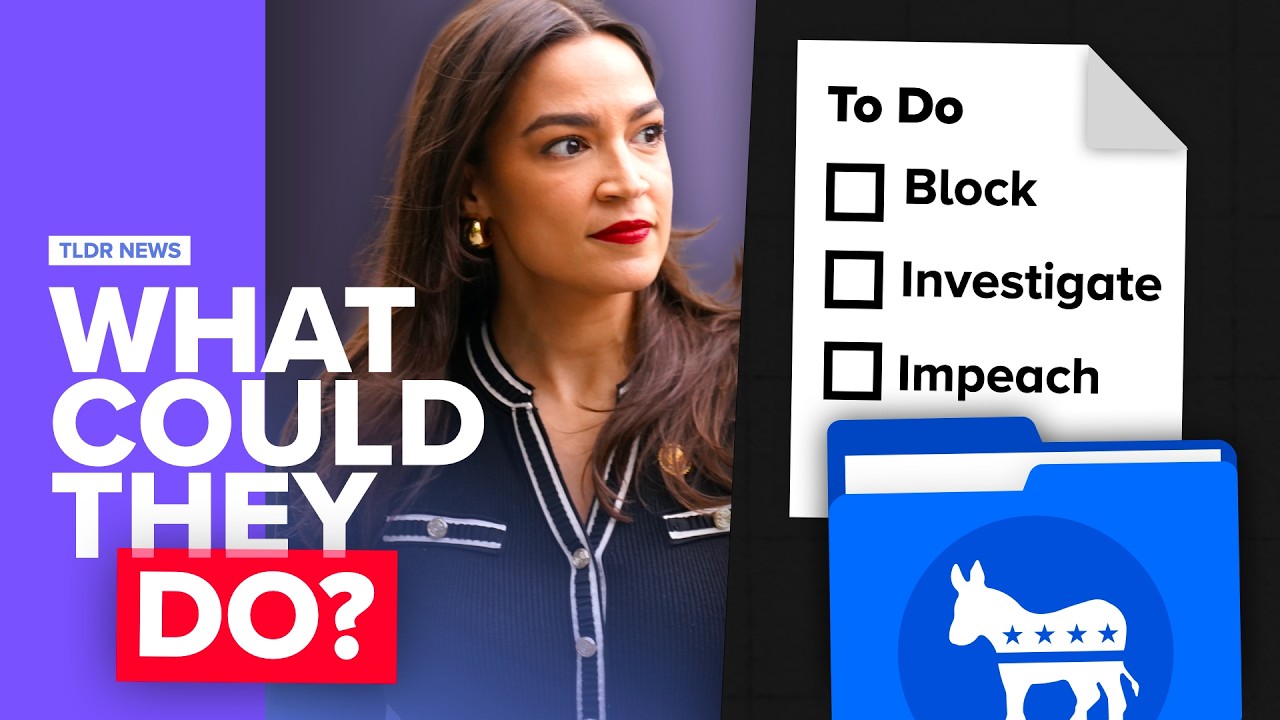
How an electoral coalition unraveled
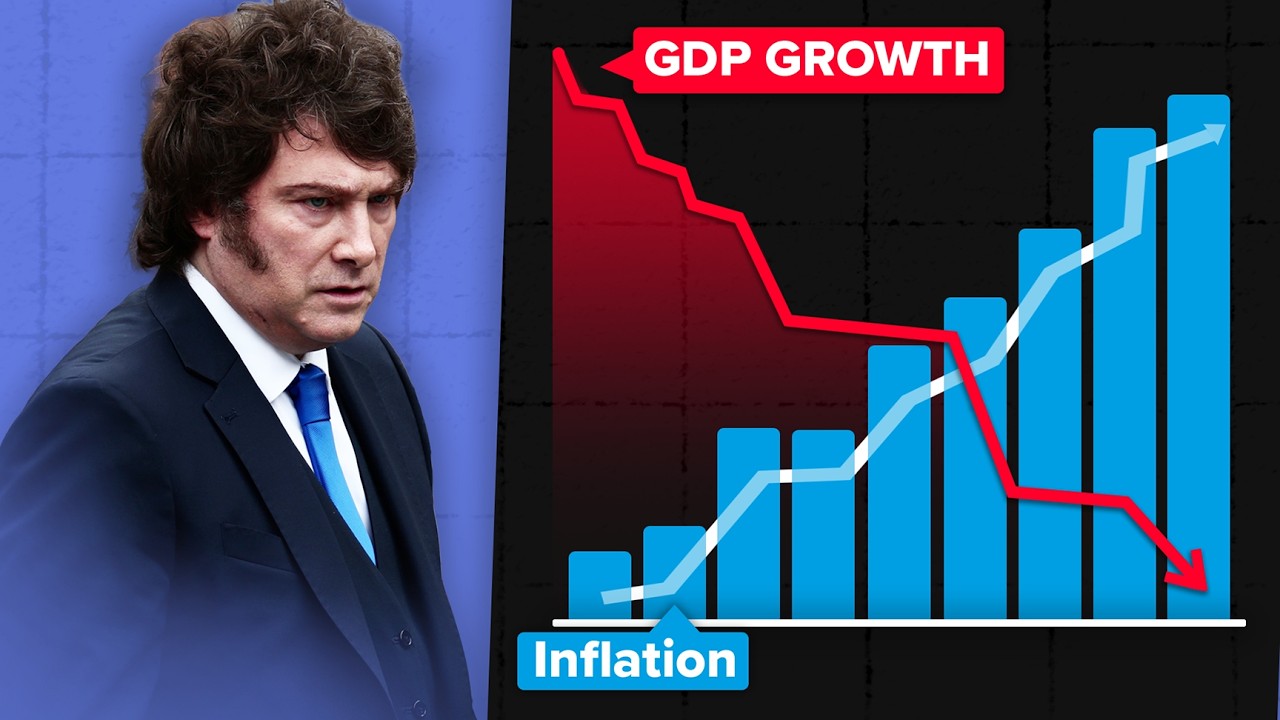
A long-form political explainer pairs a three-group before-and-after polling story with sourced charts, presenter bridges, and a campaign-ad example.
By @TLDRnewsGLOBAL for TLDR News GlobalRuns 09:00

This film opens with Library
A free account opens 100 hand-picked films. Library opens all 4,570 of them for $6 a month.
Free takes an email or Google, no card. See the plans
Why it works
The lead states a deadline and eight-point polling gap within 19 seconds, then the three-group historical baseline at 1:15–2:48 sets up matched current comparisons from 3:05. A specific campaign-ad example at 5:05–5:24 makes the abstract shift visible and overlaps the strongest replay peak at 5:18.6–5:24.0. The 42 internal graphic changes sustain visual movement through longer chart shots.
Films like this
Tagged live actionnews explainerdata storytellingpolling chartspresenter ledarchival footagepolitical analysissource footers