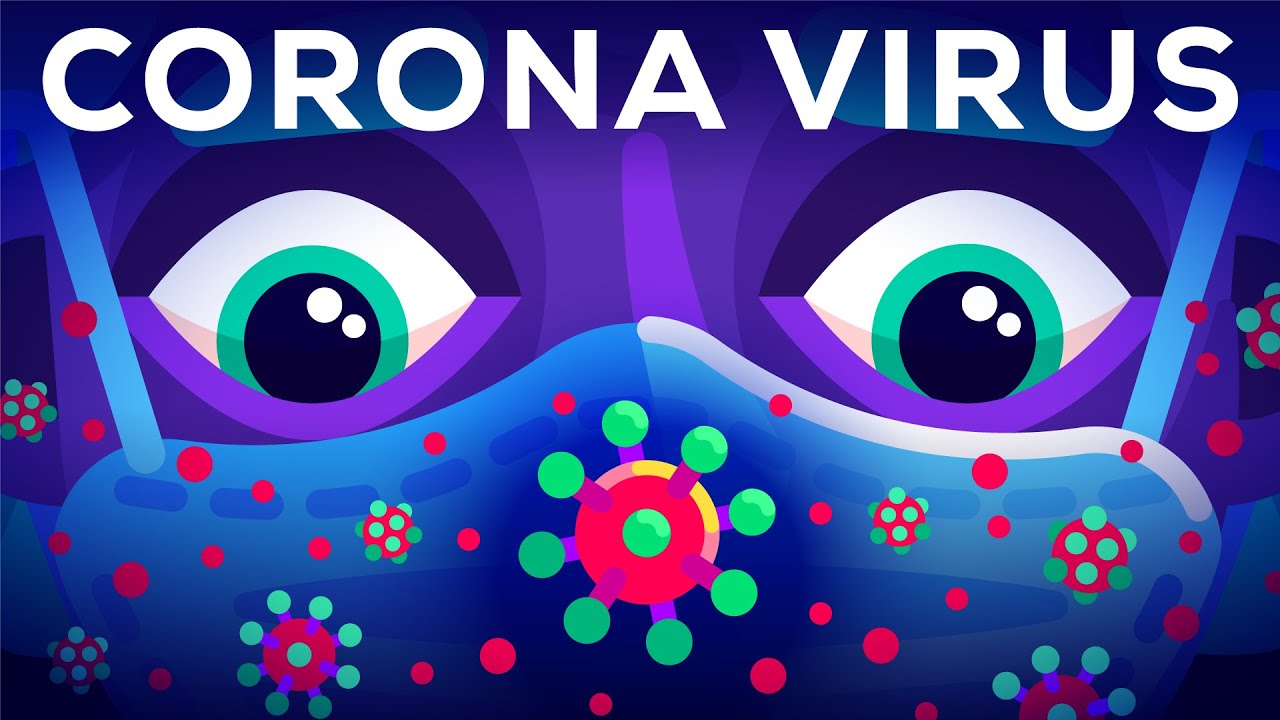
Coronavirus: From Infection to Pandemic Curves
A six-minute animated science explainer that zooms from outbreak map to cells, lungs, hospital care, and fast-versus-slow spread.
By @kurzgesagt for kurzgesagtRuns 08:34
This film opens with Library
A free account opens 100 hand-picked films. Library opens all 4,513 of them for $6 a month.
Free takes an email or Google, no card. See the plans
Why it works
The opening turns one map marker into rising infection counts by 0:02.75, then asks a practical question at 0:21.7. Color-coded diagrams shift scale from a particle at 0:38 to cells at 1:32 and population curves at 5:00; the most-replayed 4:27.8–4:32.9 interval shows the body's status through three simple meters. The detected seven macro-shots contain 75 internal visual changes, so the information advances without constant cuts.
Films like this
Tagged animated explainerscience animationvector motionvoiceoverinfographicdiagram animationcolor codinglong form