The Missing Chart, Drawn Then Debated
A hand-drawn chart becomes the standard against which familiar plotting tools visibly fail, before a precise range-chart solution and wider uses appear.
By @minutephysics for minutephysicsRuns 03:33
This film opens with Library
A free account opens 100 hand-picked films. Library opens all 4,570 of them for $6 a month.
Free takes an email or Google, no card. See the plans
Why it works
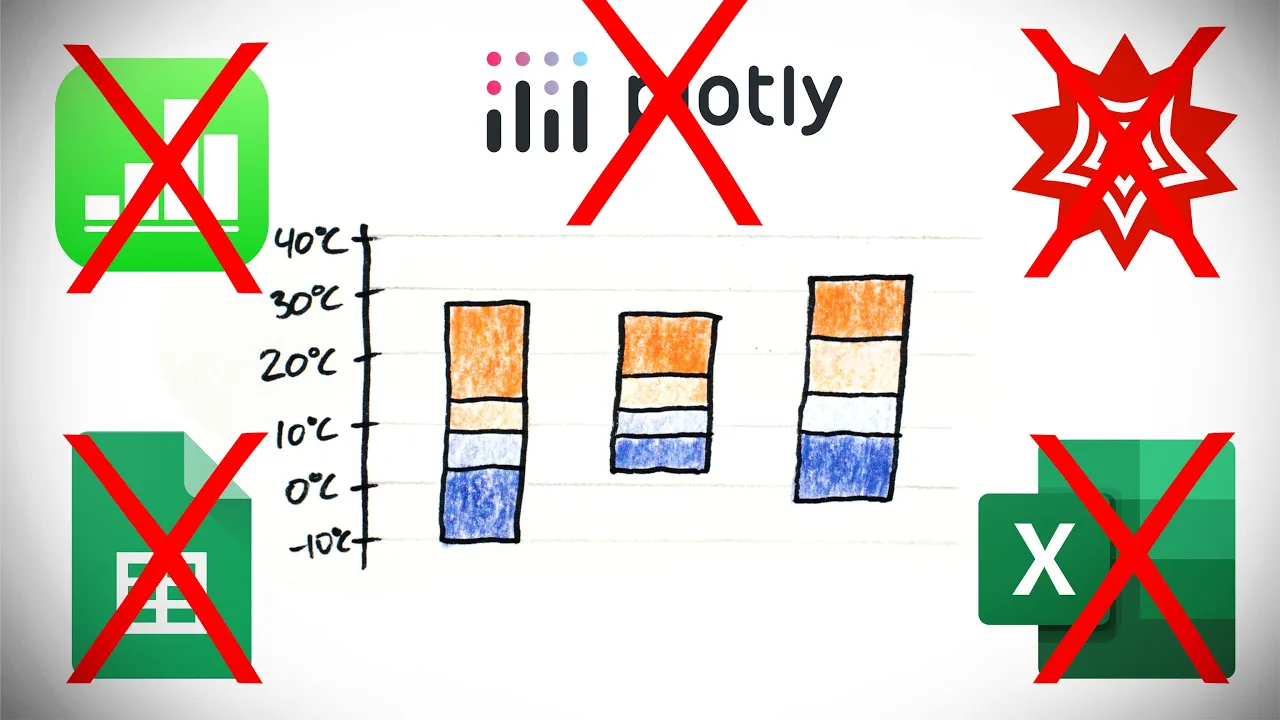
By shot 7 the film has shown the desired hand-drawn result, giving each later software test a visible standard. Shots 22 and 24 sustain long explanations through hard picture changes at frames 1208, 1251, 1280, 1693, 2136 and 2222; the named solution in shots 44–55 therefore feels earned. Shot 63 reuses the operation across new datasets instead of ending at the first answer.
Films like this
Tagged live actionscreen recordingwhiteboard explainerhand drawn chartssoftware critiquefast voiceovervisual argumentdata visualization